Swift Core Graphics教程之Gradients 与 Context
发布时间:2015-05-27 00:00 来源:Mr.Simple的专栏
欢迎回到我们的Swift核心绘图教程系列!
在第一部分中,你学习到了使用storyboard绘制线条和矩形.
在第二部部分中,你将深入核心绘图,使用CGContext实现渐变效果
更新时间 04/15/2015 为Xcode 6.3 和 Swift1.2更新
核心绘图
你现在已经从简单的UIKit深入到核心绘图。
下图是各个框架的关系图:
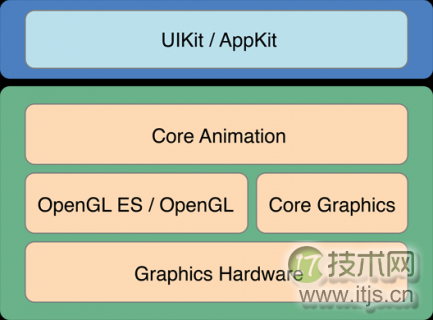
UIKit是在最顶层,使用最友好的框架。你使用过UIBezierPath的就是在UIKit层中对Core Graphics层中CGPath的封装。
你可以看到 Core Graphics 的对象和方法都是CG开头的,非常容易辨认。
另外CG方法都是C方法,在调用的时候不需要明确的指定参数名,和一般Swift调用方法不一样。
从Graph view开始
本次的目标就是使用历史数据创建一个图表。
在绘图之前,你需要创建一个storyboard,写一些显示图表的代码。
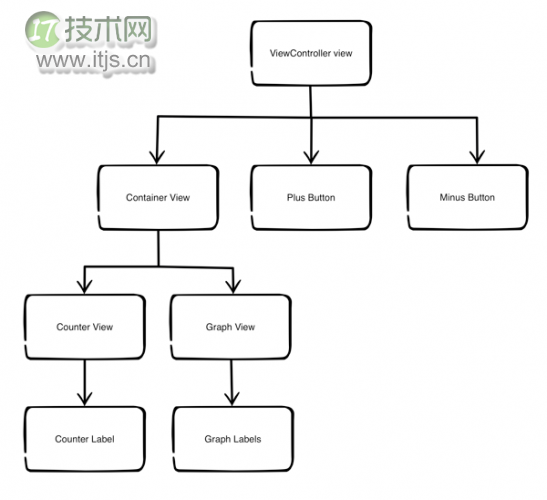
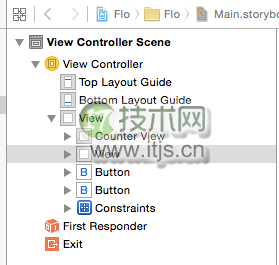
完成后的视图结构如下图:
假如你还没有完成,从这里下载开始的项目。
打开 File/New/File…, 选择 iOS/Source/Cocoa Touch Class
模板然后点击 Next. 输入名称 GraphView,选择成为 UIView 的子类,选择语言 Swift。 点击 Next 和 Create.
打开 Main.storyboard 拖一个 UIView 到控制器的视图。
视图将包含一个Graph和Counter Views,确定他们是视图控制器的主视图的子视图,并且Graph在Counter Views之上。
此时目录结构应该是这样的:
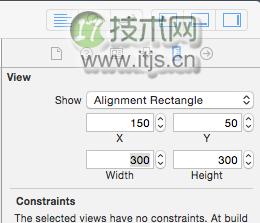
在 Size Inspector, 设置 X=150, Y=50, Width=300,
Height=300:
创建自动布局约束非常简单,在第一部分中有讲到。
选中视图, 按住Control轻轻的向左拖动,在弹出的菜单中选择Width. 选中视图, 按住Control轻轻的向上拖动,在弹出的菜单中选择Height. 选中视图, 按住Control从里向外拖动,在弹出的菜单中选择 Center Vertically in Container. 选中视图, 按住Control从里向外拖动,在弹出的菜单中选择 Center Horizontally in Container.当创建了视图,通常我们我们会设置一个临时的背景颜色,这样做非常有用,可以让我们清楚的看到我们做了什么。
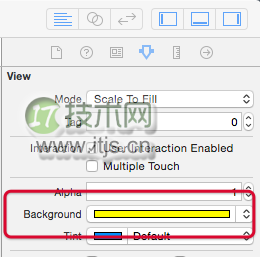
在 Attributes Inspector, 将背景颜色设置为黄色.
再拖一个 UIView 到黄色的视图作为它的子视图.
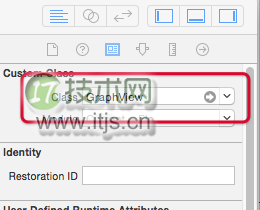
在 Identity Inspector, 将新创建的视图的class设置为GraphView.
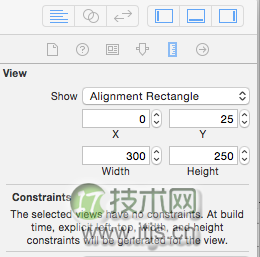
在 Size Inspector, 设置 X=0, Y=25, Width=300,
Height=250:
在Document Outline,将 Counter View拖到黄色的视图中作为它的子视图,这里需要注意需要放置在Graph View的后方。
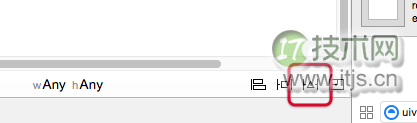
在移动 Counter View之后, 自动布局约束会变红. 选择 Counter View, 在storyboard 右下方找到并点击 Resolve Auto Layout Issues, 选择
Selected Views: Clear Constraints.
你可以重置为默认的约束,因为现在Counter View充满了整个Container View
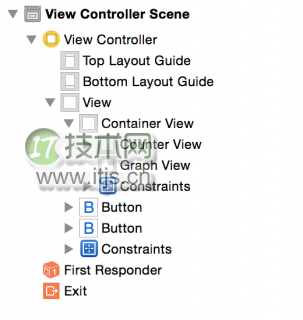
在 Document Outline 双击黄色视图来重命名为 Container View. 现在 Document Outline 是这样子的:
你需要一个Container View是因为在 Counter View 和 Graph View的渐变动画中需要用到。
打开 ViewController.swift ,为Container 和 Graph Views 添加outloets:
@IBOutlet weak var containerView: UIView!
@IBOutlet weak var graphView: GraphView!
这一步为container view 和 graph view创建outlet,现在我们将他们和storyboard的视图关联起来。
打开 Main.storyboard, 将 Graph View Container View 和 outlets关联起来:
设置渐变动画
仍然在 Main.storyboard中, 从Object Library 拖一个UITapGestureRecognizer 到 Container View:
打开 ViewController.swift 在开头添加属性:
var isGraphViewShowing = false
这个将简单的标记用于判断当前graph view是否正在显示;
为点击事件添加过渡效果的方法:
@IBAction func counterViewTap(gesture:UITapGestureRecognizer ) {
 if (isGraphViewShowing) {
//hide Graph
 UIView.transitionFromView(graphView,
 toView: counterView,
 duration: 1.0,
 options: UIViewAnimationOptions.TransitionFlipFromLeft
 UIViewAnimationOptions.ShowHideTransitionViews,
 completion:nil)
 } else {
//show Graph
 UIView.transitionFromView(counterView,
 toView: graphView,
 duration: 1.0,
 options: UIViewAnimationOptions.TransitionFlipFromRight
 UIViewAnimationOptions.ShowHideTransitionViews,
 completion: nil)
 }
 isGraphViewShowing = !isGraphViewShowing
 }
UIView.transitionFromView(_:toView:duration:options:completion:)
设置了一个水平翻动的效果. 另外还有扩散,溶解,竖直翻动,弯曲和下降等效果。 过渡效果使用ShowHideTransitionViews 系数, 你不必通过移除视图来使它消失。
在btnPushButton(_:)的最后添加以下代码:
if isGraphViewShowing {
 counterViewTap(nil)
 }
这是为了防止在图标正在显示的过程中点击,将闪回计数器视图。
最后,为了让这个效果生效,打开 Main.storyboard,将点击手势与counterViewTap(gesture:)关联起来。
构建并运行程序,你可以看到graph view在你打开程序的时候。点击它,graph view会消失,counter view现实,中间有过渡动画。
分析Graph View
还记得第一部分的绘图模型嘛?它描述了用Core Graphics绘图从里到外的过程,你需要明白这里的顺序在你写代码之前:
渐变的背景 在图表中进行裁剪 折线 折线点 横线 标签绘制渐变
现在我们在Graph View 的 context中绘制渐变效果。
打开 GraphView.swift 将里面带代码替换为以下:
import UIKit
@IBDesignable class GraphView: UIView {
//1 - the properties for the gradient
 @IBInspectable var startColor: UIColor = UIColor.redColor()
 @IBInspectable var endColor: UIColor = UIColor.greenColor()
override func drawRect(rect: CGRect) {
//2 - get the current context
 let context = UIGraphicsGetCurrentContext()
 let colors = [startColor.CGColor, endColor.CGColor]
//3 - set up the color space
 let colorSpace = CGColorSpaceCreateDeviceRGB()
//4 - set up the color stops
 let colorLocations:[CGFloat] = [0.0, 1.0]
//5 - create the gradient
 let gradient = CGGradientCreateWithColors(colorSpace,
 colors,
 colorLocations)
//6 - draw the gradient
 var startPoint = CGPoint.zeroPoint
 var endPoint = CGPoint(x:0, y:self.bounds.height)
 CGContextDrawLinearGradient(context,
 gradient,
 startPoint,
 endPoint,
 0)
 }
 }
这里有以下步骤
将渐变的开始和结束颜色设置为@IBInspectable 属性,这样就可以在storyboard中实时看到效果. CG 绘图方法需要知道他们在哪个上下文(context)中绘图,,调用 UIGraphicsGetCurrentContext() 来获取当前上下文. 那就是 drawRect(_:) 绘制的地方. 所有的上下文都有一个色域. 可以是 CMYK 也可以是 grayscale,这里使用的是RGB色域. 颜色的起止描述了颜色的变化效果. 在这个例子中, 你只有两种颜色,从红到绿,
你也可以又一个数组的颜色变化, 颜色从红到蓝在到绿. 每种颜色的起止都是0.33. 创建渐变效果,定义色域,颜色起止。 最后,绘制渐变效果通过方法CGContextDrawLinearGradient()
有以下几个参数: CGContext表示在哪个上下文 CGGradient 色域,颜色起止。 开始点 结束点 其他延伸选项
通过drawRect(_:)渐变效果将充满整个rect。
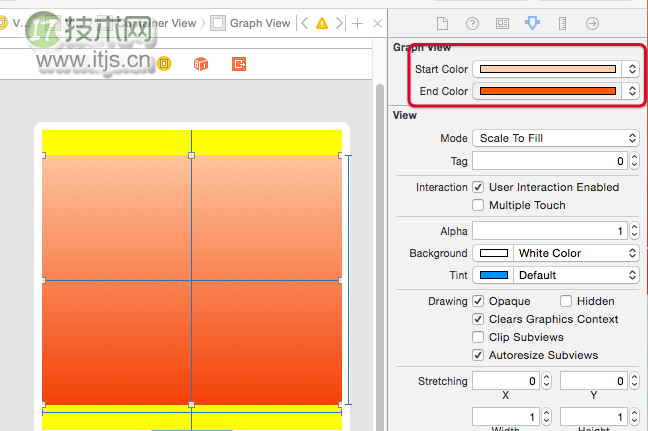
在Xcode你通过设置代码或者在storyboard的Assistant Editor调节,可以直接在Graph View看到效果。
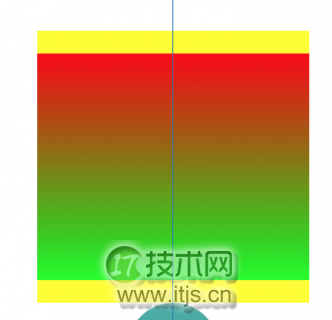
在storyboard中, 选择 Graph View. 在 *Attributes
Inspector*设置 Start Color 为 RGB(250, 233, 222), 设置 End Color 为RGB(252, 79, 8):
在 Main.storyboard, 一次选择所有的视图,除了控制器自带的,将他们的BackgroundColor 设置为clear color. 现在已经不需要黄色背景了,同样将按钮的背景颜色设置为透明.
运行程序,你会发现现在变得好看很多。
裁剪区域
你刚才用渐变填充了整个上下文的区域。现在你可以创建路径来裁剪当前的绘图区域。
打开GraphView.swift, 在drawRect(_:)的顶部加入以下代码:
let width = rect.width
 let height = rect.height
//set up background clipping area
 var path = UIBezierPath(roundedRect: rect,
 byRoundingCorners: UIRectCorner.AllCorners,
 cornerRadii: CGSize(width: 8.0, height: 8.0))
 path.addClip()
这个将创建一个裁剪区域来限制渐变效果,你可以用相同的方式绘制渐变效果在在折线上。
构建运行程序,你会发现有漂亮的圆角效果:

注意: 绘制静态的图像使用Core Graphics是绰绰有余的,但是当你的图像需要频繁的重绘时,你应当使用Core Animation layers,它充分利用了GPU而不是CPU。CPU是通过调用 drawRect(_:)绘制的。
除了使用裁剪路径,你还可以通过使用CALayer的cornerRadius属性来创建圆角,但是你需要优化。为了更好的理解,可以参考Mikael Konutgan and Sam Davies写的Custom Control Tutorial for iOS and Swift: A Reusable
Knob,使用Core Animation来创建自定义控件。
计算坐标点
现在可以短暂了停一下画图,我们需要绘制7个点,横坐标为一周的七天,纵坐标为
首先, 设置几个简单的值。
在 GraphView.swift, 在顶部添加属性:
//Weekly sample data
 var graphPoints:[Int] = [4, 2, 6, 4, 5, 8, 3]
这里简单的数据代表了七天的数据。
接着,在drawRect(_:)的最后添加代码:
//calculate the x point
let margin:CGFloat = 20.0
 var columnXPoint = { (column:Int) -> CGFloat in
 //Calculate gap between points
 let spacer = (width - margin*2 - 4) /
 CGFloat((self.graphPoints.count - 1))
 var x:CGFloat = CGFloat(column) * spacer
 x += margin + 2
 return x
 }
横坐标点包括了7个等距离的点。上述代码在一个闭包表达式中,应该是要独立的封装成一个方法,但是对于这个小的运算量,是可以内嵌在代码之中。
columnXPoint 接受 column作为参数, 返回点所在的横坐标的值.
接着,在drawRect(_:)的最后添加代码来计算纵坐标的点:
// calculate the y point
let topBorder:CGFloat = 60
 let bottomBorder:CGFloat = 50
 let graphHeight = height - topBorder - bottomBorder
 let maxValue = maxElement(graphPoints)
 var columnYPoint = { (graphPoint:Int) -> CGFloat in
 var y:CGFloat = CGFloat(graphPoint) /
 CGFloat(maxValue) * graphHeight
 y = graphHeight + topBorder - y // Flip the graph
 return y
 }
columnYPoint 同样的也在一个闭包表达式中,将数组中得每一天作为参数.返回纵坐标的位置, 在0和最大饮水量之间.
因为起始点为左上角,但是你是从左下角开始绘制, columnYPoint会调整它的返回值来朝向你期望的地方。
继续在drawRect(_:)的底部添加以下代码:
// draw the line graph
UIColor.whiteColor().setFill()
 UIColor.whiteColor().setStroke()
//set up the points line
 var graphPath = UIBezierPath()
 //go to start of line
 graphPath.moveToPoint(CGPoint(x:columnXPoint(0),
 y:columnYPoint(graphPoints[0])))
//add points for each item in the graphPoints array
 //at the correct (x, y) for the point
 for i in 1..<graphPoints.count {
 let nextPoint = CGPoint(x:columnXPoint(i),
 y:columnYPoint(graphPoints[i]))
 graphPath.addLineToPoint(nextPoint)
 }
graphPath.stroke()
在这个代码快中,你创建了图标的路径, UIBezierPath用来连接graphPoints种的每一个点。
现在,storyboard中的图标看起来是这样的:

现在你验证了线已经正确绘制,从drawRect(_:)移除最后一行代码
graphPath.stroke()
这行代码让你检查线在storyboard是否被正确的绘制,点是否计算正确.
图表渐变
现在在这个折线的路径之下来绘制渐变效果.
首先设置裁剪路径在drawRect(_:)的最下方:
//Create the clipping path for the graph gradient
//1 - save the state of the context (commented out for now)
 //CGContextSaveGState(context)
//2 - make a copy of the path
 var clippingPath = graphPath.copy() as! UIBezierPath
//3 - add lines to the copied path to complete the clip area
 clippingPath.addLineToPoint(CGPoint(
 x: columnXPoint(graphPoints.count - 1),
 y:height))
 clippingPath.addLineToPoint(CGPoint(
 x:columnXPoint(0),
 y:height))
 clippingPath.closePath()
//4 - add the clipping path to the context
 clippingPath.addClip()
//5 - check clipping path - temporary code
 UIColor.greenColor().setFill()
 let rectPath = UIBezierPath(rect: self.bounds)
 rectPath.fill()
 //end temporary code
通过上述代码让块于块之间分割:
CGContextSaveGState 现在先不讨论CGContextSaveGState,一会来说它是干嘛的。 复制一个新的路径来定义需要被填充的区域. 完成区域的角点并关闭路径。这增加了右下和左下的点. 添加裁剪区域,当上下文被填充时,只有被裁减的区域会被填充。 填充上下文. 记住 rect就是上下文传递给drawRect(_:)被填充的区域。现在storyboard中的图标看起来应该是这样的:

下一步,你会将可爱的绿色换成你为背景创建的渐变的效果
移除drawRect(_:)底部填充绿色的临时代码,换成以下代码:
let highestYPoint = columnYPoint(maxValue)
 startPoint = CGPoint(x:margin, y: highestYPoint)
 endPoint = CGPoint(x:margin, y:self.bounds.height)
CGContextDrawLinearGradient(context, gradient, startPoint, endPoint, 0)
 //CGContextRestoreGState(context)
在这里,你将找到最大的数字作为渐变的起点。
You can’t fill the whole rect the same way you did with the green
color. The gradient would fill from the top of the context instead of
from the top of the graph, and the desired gradient wouldn’t show up.
你不能填充这个rect就像填充绿色一样,渐变会从上下问得顶部而不是图标的顶部开始进行渐变。
注意CGContextRestoreState的注释,你在绘制之后需要取消注释。
在 drawRect(_:)之后添加代码:
//draw the line on top of the clipped gradient
 graphPath.lineWidth = 2.0
 graphPath.stroke()
这里绘制了原始的路径
现在图标看起来是这样的:

在drawRect(_:)的底部添加:
//Draw the circles on top of graph stroke
 for i in 0..<graphPoints.count {
 var point = CGPoint(x:columnXPoint(i), y:columnYPoint(graphPoints[i]))
 point.x -= 5.0/2
 point.y -= 5.0/2
let circle = UIBezierPath(ovalInRect:
 CGRect(origin: point,
 size: CGSize(width: 5.0, height: 5.0)))
 circle.fill()
 }
绘制小圆点的代码并不是新的。这里将为每一个数组中的元素的位置绘制一个圆点。

现在为什么不好看呢,对了,小圆点。没事,我们一会加上去。
上下文状态
图形上下文可以保存状态。当你设置了许多上下文属性,如填充颜色,色域,变换矩阵,或裁剪区域,你实际上设置为当前图形状态。
你可以使用CGContextSaveGState()保存状态,这会就将当前状态的拷贝压进状态栈。你可以改变上下文的属性,但是当你调用CGContextRestoreGState()原来的状态将会出栈,还原当前的状态。
在 GraphView.swift的drawRect(_:)方法中,注意CGContextSaveGState() 发生在创建裁剪路径之前, CGContextRestoreGState()发生在裁剪路径之后。
这里我们做了一下几点:
1. 通过CGContextSaveGState()将原始状态压入栈.
2. 添加裁剪路径到新的状态.
3. 在裁剪路径中绘图.
4. 通过CGContextRestoreGState()还原状态,这是在添加裁剪路径前的状态。
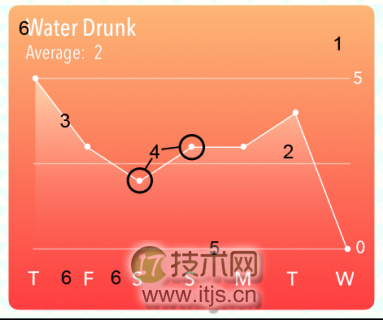
现在的图标和圆点看起来更加的清晰:

在 drawRect(_:)后添加代码来添加三条横线:
//Draw horizontal graph lines on the top of everything
 var linePath = UIBezierPath()
//top line
 linePath.moveToPoint(CGPoint(x:margin, y: topBorder))
 linePath.addLineToPoint(CGPoint(x: width - margin,
 y:topBorder))
//center line
 linePath.moveToPoint(CGPoint(x:margin,
 y: graphHeight/2 + topBorder))
 linePath.addLineToPoint(CGPoint(x:width - margin,
 y:graphHeight/2 + topBorder))
//bottom line
 linePath.moveToPoint(CGPoint(x:margin,
 y:height - bottomBorder))
 linePath.addLineToPoint(CGPoint(x:width - margin,
 y:height - bottomBorder))
 let color = UIColor(white: 1.0, alpha: 0.3)
 color.setStroke()
linePath.lineWidth = 1.0
 linePath.stroke()
没有新的代码,你需要做的只是移动到一个点然后水平画线。

添加图标的标签
现在你可以添加标签来让图标的用户体验更好。
在ViewController.swift添加 outlets 属性:
//Label outlets
 @IBOutlet weak var averageWaterDrunk: UILabel!
 @IBOutlet weak var maxLabel: UILabel!
这两个标签将会动态的改变内容(饮水量的平均值和最大值)。
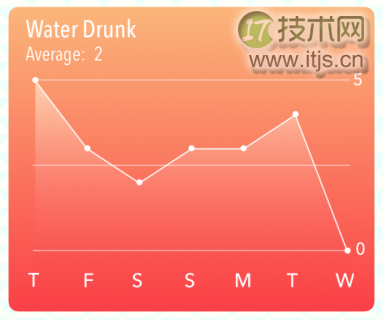
在 Main.storyboard 添加以下的 UILabels 作为 Graph View的子视图:
“Water Drunk” “Average:” “2” (平均饮水量) “99” (最大饮水量). 右对齐 “0”. 右对齐 每一天的标签,居中对齐.通过Shift全选所有标签,改变字体为Avenir Next Condensed, Medium style.

在Main.storyboard关联averageWaterDrunk 和 maxLabel .按住Control从View Controller拖分别拖到相应的标签。
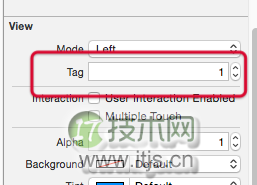
对于每天得标签来说,在Attributes Inspector 改变 View’s Tag 属性,分别食从1到7
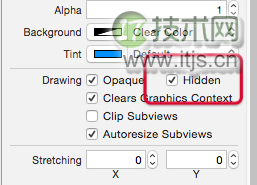
现在已经完成了图标的设置,在Main.storyboard 选择 Graph View并选择Hidden,让程序第一次出现的时候不显示图标。
在 ViewController.swift 添加以下方法来设置标签:
 func setupGraphDisplay() {

   //Use 7 days for graph - can use any number,
   //but labels and sample data are set up for 7 days
   let noOfDays:Int = 7

   //1 - replace last day with today's actual data
   graphView.graphPoints[graphView.graphPoints.count-1] = counterView.cou
 nter

   //2 - indicate that the graph needs to be redrawn
   graphView.setNeedsDisplay()

   maxLabel.text = "/(maxElement(graphView.graphPoints))"

   //3 - calculate average from graphPoints
   let average = graphView.graphPoints.reduce(0, combine: +)
             / graphView.graphPoints.count
   averageWaterDrunk.text = "/(average)"

   //set up labels
   //day of week labels are set up in storyboard with tags
   //today is last day of the array need to go backwards

   //4 - get today's day number
   let dateFormatter = NSDateFormatter()
   let calendar = NSCalendar.currentCalendar()
   let componentOptions:NSCalendarUnit = .CalendarUnitWeekday
   let components = calendar.components(componentOptions,
                                        fromDate: NSDate())
   var weekday = components.weekday

   let days = ["S", "S", "M", "T", "W", "T", "F"]

   //5 - set up the day name labels with correct day
   for i in reverse(1...days.count) {
     if let labelView = graphView.viewWithTag(i) as  UILabel {
       if weekday == 7 {
         weekday = 0
       }
       labelView.text = days[weekday--]
       if weekday < 0 {
         weekday = days.count - 1
       }
     }
   }
 }
This looks a little burly, but it’s required to set up the calendar and retrieve the current day of the week. Take it in sections:
这看起来有点粗鲁的,但它需要设置日历和知道今天是星期几:
你设置今天的数据将会作为数组的最后一个元素插入. 在最后的项目中,Part3,你可以扩展到60天的数据, 将会有一个方法来选取起止时间,但是这超出了本章的讲解内容 :] 假如今天有变化,重绘数据. 这里你使用 Swift的 reduce 来计算一周的平局饮水量; 这个在计算数组的总和的时候非常有用。 这一部分将当前的日期作为iOS的日历一周的结束. 这个循环从7到1,通过tag来获取相应的视图,这是正确的标题从days数组中。
还是在ViewController.swift,在counterViewTap(_:)方法的else分支中调用新方法来显示图表:
“`
setupGraphDisplay()
“`
运行程序,点击计数器,万岁,图表将显示所有的数据。
掌握矩阵
现在程序看起来有点突兀,我们子啊第一部分创建的计数器还需要提升一下,在饮水量上添加指示。

现在已经有CG方法绘图的一些经验了,你将会使用旋转和平移。
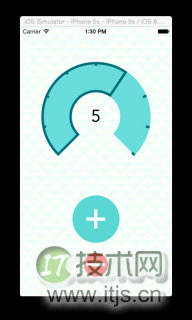
可以看出这个标志都是从中心辐射的:
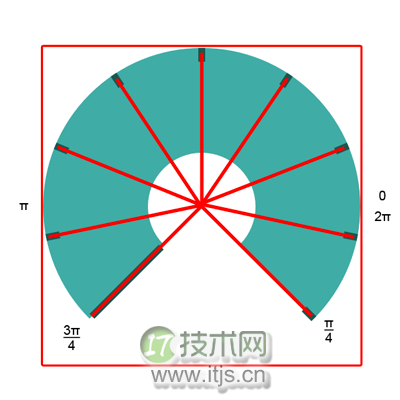
和在上下文绘图一样,你可以通过旋转,缩放,和平移来进行矩阵变幻。
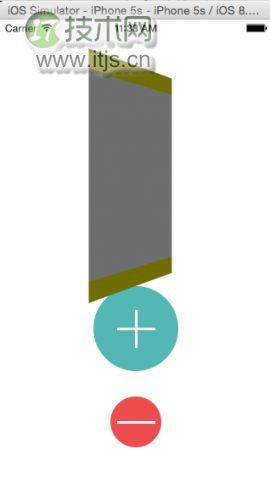
一开始这可能是令你费解的,但是在经过一些练习之后,将会变得更有意义,变换的顺序非常重要,我先说画出你需要做的示意图。
下面的示意图就是通过旋转然后在中间绘制矩形的结果。
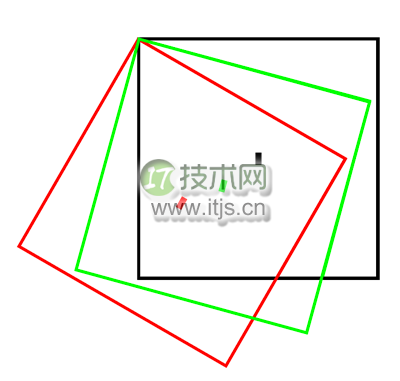
黑色的矩形食旋转前的上下文。然后是绿的,再是红得。有两件事需要注意。
上下文根据左上角进行旋转。 矩形依然绘制在中心在旋转之后.当你绘制计数器的标志的时候,你需要先旋转上下文,然后再绘制它。
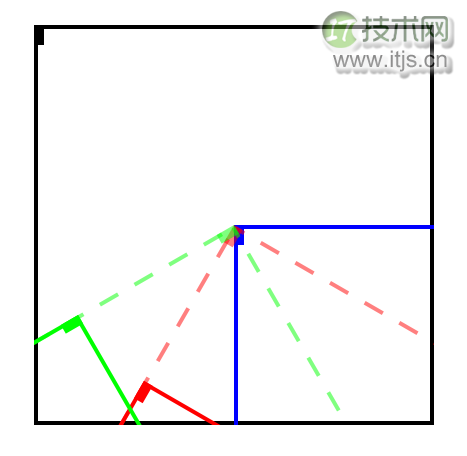
在这个示意图中,矩形的标记在左上方,蓝色轮廓就是变换的上下文,然后上下文旋转(红色虚线),然后再次旋转。
最后当红色的标识被绘制完之后,它的角度如图所示:
在上下文旋转和平移得到红色标记之后,它需要回到中心来进行下一次的变换得到绿的标志。
就像你在裁剪的时候保存上下文一样,你需要保存和恢复上下文状态在每次矩阵变换的时候。
打开CounterView.swift 在drawRect(_:)的最后添加代码来增加标记:
 //Counter View markers

 let context = UIGraphicsGetCurrentContext()

 //1 - save original state
 CGContextSaveGState(context)
 outlineColor.setFill()

 let markerWidth:CGFloat = 5.0
 let markerSize:CGFloat = 10.0

 //2 - the marker rectangle positioned at the top left
 var markerPath = UIBezierPath(rect:
        CGRect(x: -markerWidth/2,
        y: 0,
        width: markerWidth,
        height: markerSize))

 //3 - move top left of context to the previous center position
 CGContextTranslateCTM(context,
                       rect.width/2,
                       rect.height/2)

 for i in 1...NoOfGlasses {
   //4 - save the centred context
   CGContextSaveGState(context)

   //5 - calculate the rotation angle
   var angle = arcLengthPerGlass * CGFloat(i) + startAngle - π/2

   //rotate and translate
   CGContextRotateCTM(context, angle)
   CGContextTranslateCTM(context,
                         0,
                         rect.height/2 - markerSize)

   //6 - fill the marker rectangle
   markerPath.fill()

   //7 - restore the centred context for the next rotate
   CGContextRestoreGState(context)
 }

 //8 - restore the original state in case of more painting
 CGContextRestoreGState(context)
这里你做了下面几点:
矩阵变换之前,保存上下文状态. 得到位路劲的位置和形状,但是现在还不绘制. 旋转能够围绕原始的中心点(上面的蓝色线) 对于每个标志, 首先保存居中上下文状态. 根据先前计算的值来进行旋转和平移上下文. 在旋转后的左上角绘制矩形并平移. 读取居中上下文状态 读取最原始的上下文状态.喔,干的不错,现在来运行程序,欣赏这个漂亮的界面。
接下来该做什么?
这里,是到现在为止为止所有的代码.
现在你已经学会了绘制路径,渐变效果和通过上下文的矩阵变化
在第三部分的核心绘图教程中,你将创建图案的背景和绘制矢量图。